
Digital twins of landscapes for active management
Living, measured models of DeepForest's sites, built from drone photos and 3D models, LiDAR, satellite time series, AI-managed remote sensing and dated field records, and kept for years so active management (thinning, fuel breaks, biochar, seeding and grazing) can be planned, tested and tracked: where the work was done, how the land responds, and the carbon it holds, as estimates.
Photo: DeepForest
About this project
What we’re tracking
- Drone photo sets, elevation models and maps of each site, flown again across seasons and years
- Tree heights and canopy structure from LiDAR and drone models, as a baseline for thinning and regrowth
- Satellite vegetation, moisture and burn-ratio indices through the seasons
- Where and when each treatment happened (thinning, fuel breaks, kiln burns, seeding), from treatment plans and dated field records
- Change on treated ground over the years, including regrowth, wildlife and the carbon in trees and soils (as estimates)
A digital twin of a landscape is a measured model of the land that stays current. This project builds them for DeepForest’s sites: drone photos and the 3D models made from them, LiDAR, satellite time series, AI-managed remote sensing and dated field records, on one map and one timeline, so the same ground can be compared across seasons and years.
It is a long-running line of work. The ideas behind it, and early prototypes of the tools, go back further than DeepForest itself; the sites give that work real ground to be built and tested on.
The point is active management. Thinning, fuel breaks, kiln burns for biochar, seeding and grazing all change the land. A twin lets us plan that work against real terrain and vegetation, try it on the ground and follow what happens over the years: where fuel was treated, how the vegetation grows back, and how much carbon the trees and soils hold (as estimates).
What runs today
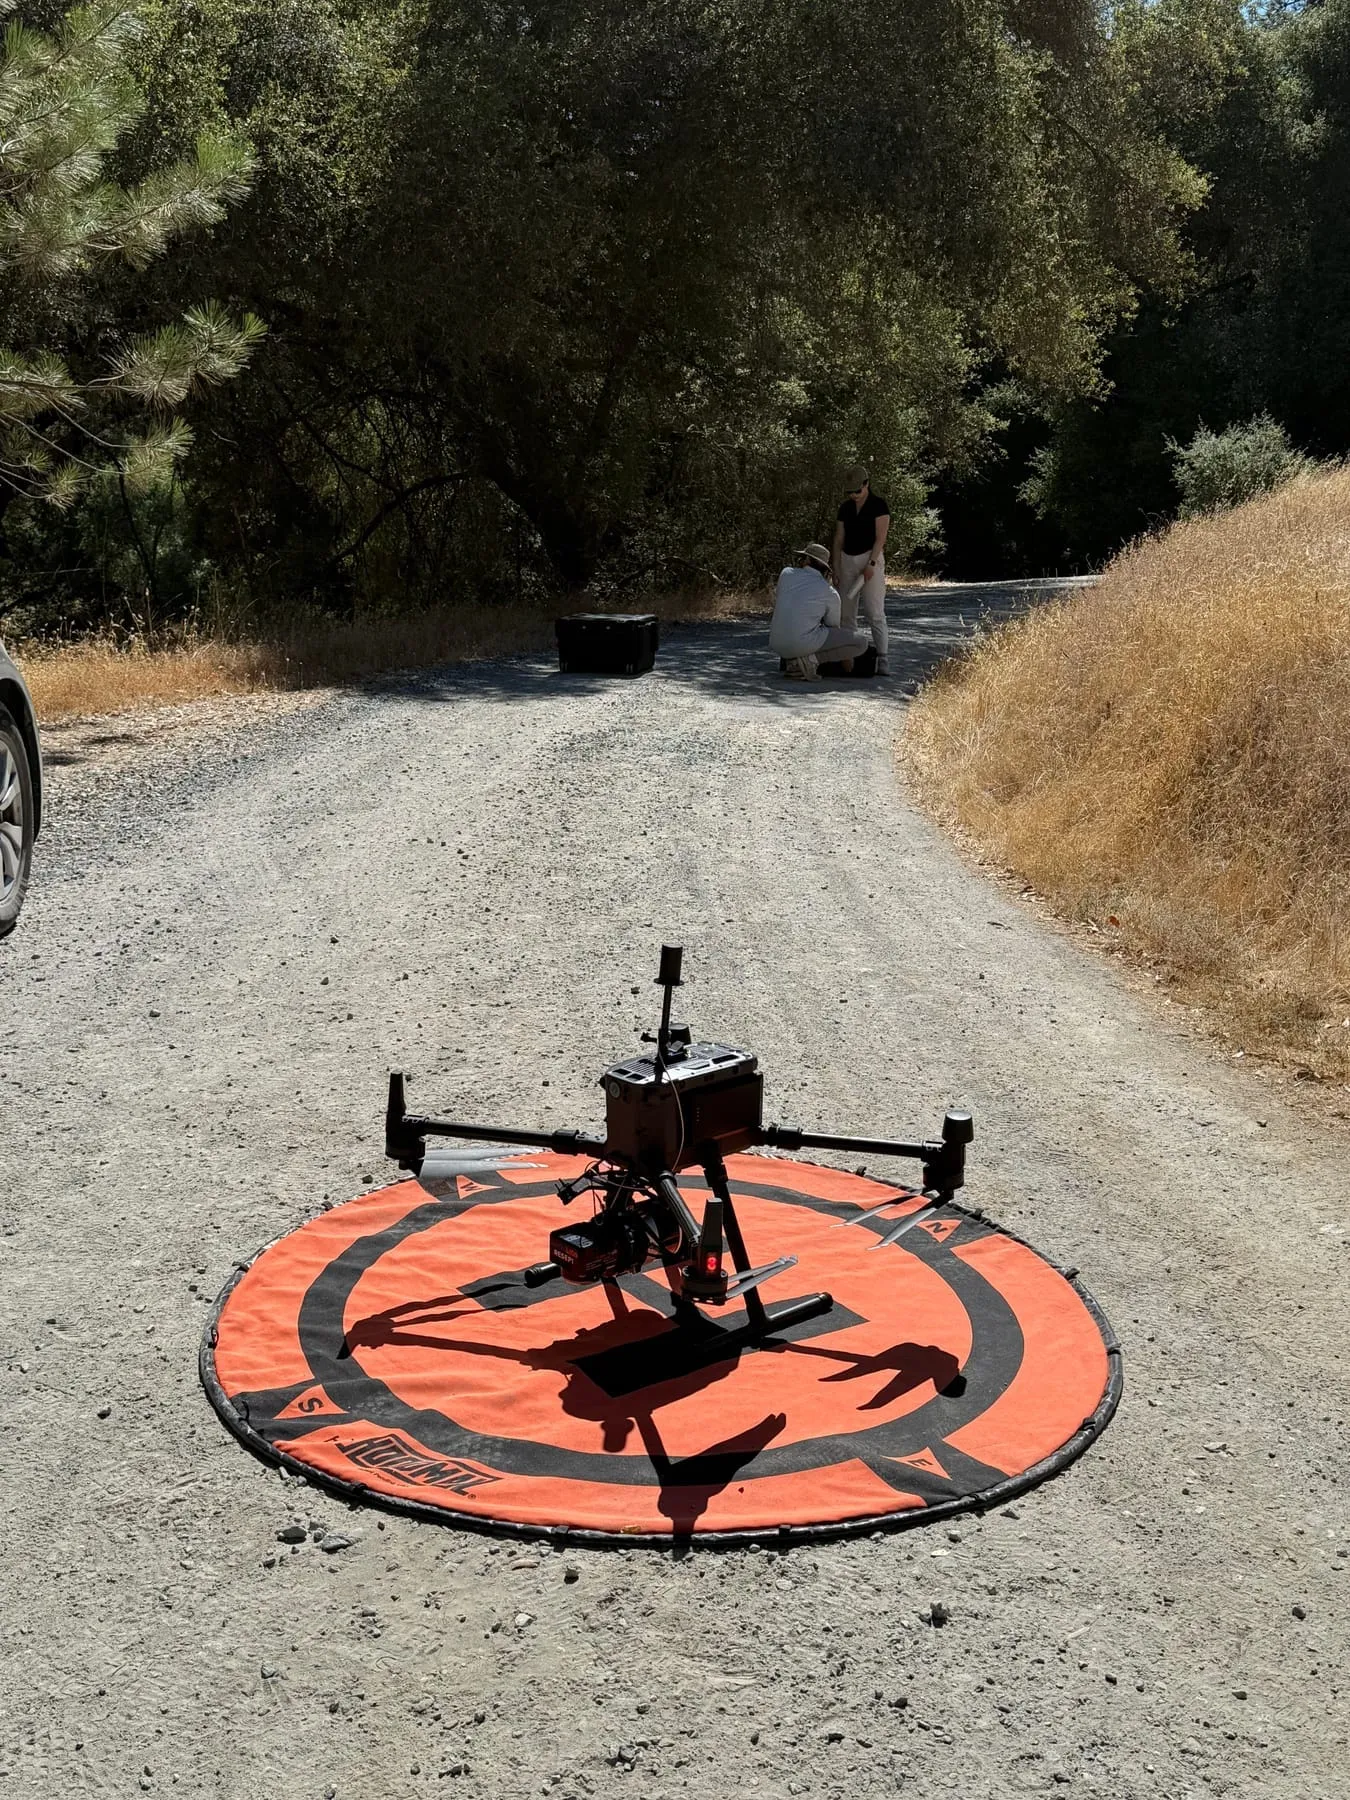
- The drone record. Repeat flights record Woodland Hilltop Arbory and San Domingo Arbory from the air through the seasons. Flight logs with positions stay private.
- An elevation model of Woodland Hilltop. A mapping flight took about 300 overlapping photos of the hilltop, which were stitched into an orthomosaic (a single, map-accurate image) and an elevation model showing the ground and each tree crown in relief.
- Meadow mapping tests. Low flights over a meadow at San Domingo took more than 1,200 overlapping photos over two days, the kind of set that can become a map or 3D model and be flown again to compare.
- Forest mapping with coolant.earth. We tested drone mapping at San Domingo with coolant.earth, a technology partner that builds 3D models of forests from drone photos and measures every tree in them. The tests returned a canopy height model of the area flown and a table of individual trees with their height, crown size and estimated trunk diameter.
- LiDAR. A canopy-height model built from LiDAR data for San Domingo’s forest management plan maps tree heights across the property, a baseline for measuring thinning and regrowth.
- Treatment plans. Treatment plans for San Domingo are mapped over public layers: 1-meter LiDAR hillshade and slope, the SSURGO soil survey, NLCD land cover, state fire-hazard zones, climate and watersheds. They were drawn in Understory, DeepForest’s first prototype for bringing site information together and drafting grant proposals.
- Satellite time series. Sentinel-2 time-lapses of San Domingo, with charts of vegetation (NDVI), moisture and burn-ratio indices through the seasons, are a baseline for regrowth after treatment. Updating them season by season is still to come.
- AI-managed remote sensing. Solar-powered cameras at San Domingo upload wildlife images day and night, and AI helps us work through drone footage and smartphone photos from the field. Connecting the camera record to the twins is one of the next steps.
How it serves the rest of the work
- Biochar from fuel reduction. Kiln burns are recorded in dated photos and drone footage. With the plans and satellite baseline, the twin should show where fuel was reduced, where the biochar went and how the land responded. The planned soil plots (biochar-amended and untreated) would be its first field plots.
- Woodland Hilltop restoration. Repeat photos from the ground and the air follow how masticated and thinned ground grows back. The elevation model records the hilltop as it was before DeepForest’s restoration work there began.
- AI-managed remote sensing. On the same timeline as fuel reduction and kiln burns, camera images, drone footage and field photos can show whether wildlife activity and vegetation change as the work goes on. Camera positions stay private.
- Meadows along San Domingo Creek. The satellite greenness and moisture series and the drone record follow how long the meadows stay green into the dry season, a starting record for asking whether restoration can keep them wet longer. The only stream record we have found is a decades-old daily flow record from a USGS gauge farther down the creek.
What comes next
- Field plots and sensors. Soil plots, then soil-moisture and weather sensors. Sensor locations are never published.
- More layers, kept current. Repeat drone surveys, the camera record, and more public data (LANDFIRE fuels, GEDI canopy structure, NISAR soil moisture, CIMIS evapotranspiration and fire-weather feeds).
- Metrics. Carbon, forest health and invasive species metrics are in development. None reports numbers yet.
- Questions in plain language. Ask the twin about a site and get an answer that cites the records behind it.
- An open schema. We plan to document how the records are structured and release part of it as open source for other landholders.
Get involved
Working on drone mapping, remote sensing, forest measurement or land-management software, or want to test a method on real ground? Contact us to compare notes.